Ongoing projects

Vickovic Lab is inviting five motivated students from Columbia University to join two innovative research projects this upcoming year. These opportunities offer a unique chance to work at the intersection of computational science and biomedical engineering, applying your skills to real-world challenges in brain function and spatial gene expression analysis.

Positions provide flexible work arrangements throughout Spring and Fall of 2026 (8 hours per week or for credit), or Summer 2026 (40 hours per week or for credit). If you are a junior, senior, or first-year master’s student eager to contribute to cutting-edge research and gain invaluable hands-on experience, we encourage you to consider these exciting opportunities.
Apply here.

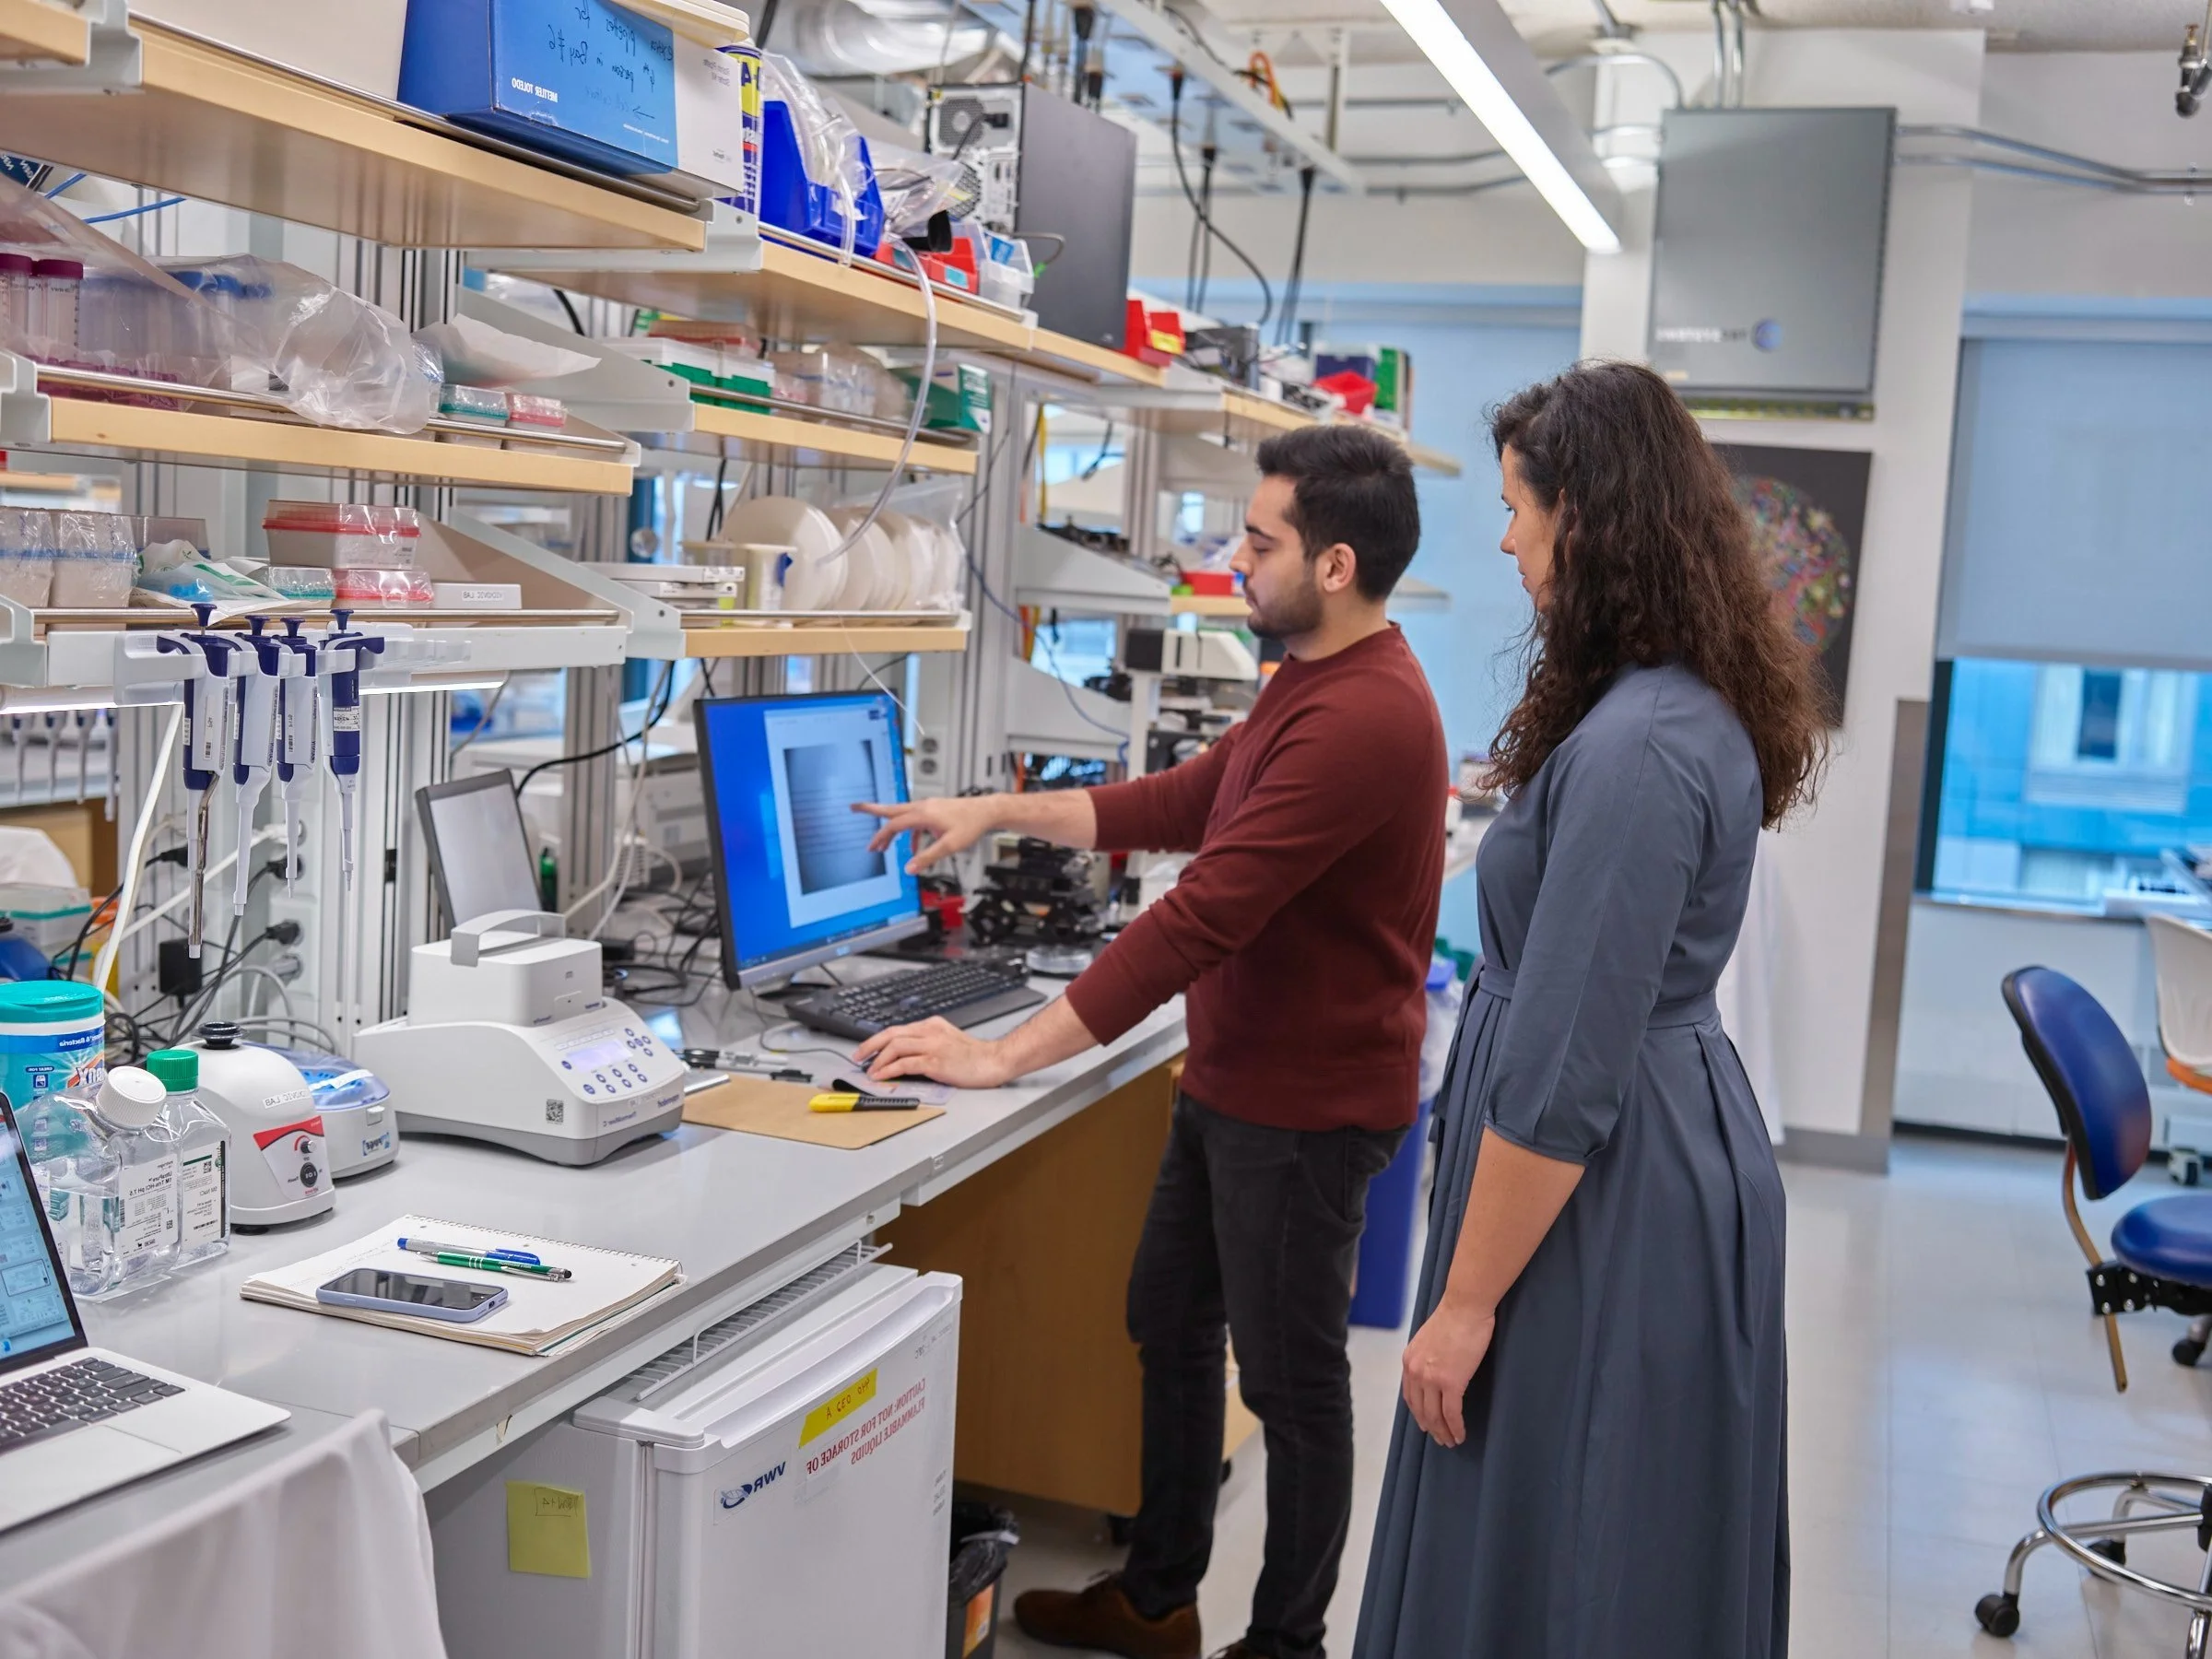
  • Two scientists working in a laboratory, focusing on equipment and a computer screen, with shelves containing laboratory supplies in the background.

    Graph alignment matching for volumetric data

    The ability to gather paired functional and spatial transcriptomic data would greatly improve our understanding of neuronal cell behavior and brain states. We aim to align data from in vivo functional imaging and post mortem fluoroscent imaging using a graph neural network approach. The goal of this project is to develop a tool to align 2D and 3D data for improved prediction of neuronal activity.

  • A man in a laboratory is smiling while working with laboratory equipment and supplies, including test tubes, pipettes, and chemicals, in a well-lit room with shelves of lab materials.

    Spatial transcriptomics for analysis of colorectal cancers

    This project leverages spatial transcriptomics to study how colorectal tumors transition from canonical to non-canonical states during metastasis. It focuses on optimizing data visualization, tissue annotation, and machine learning algorithms to enhance the discovery of spatial tissue domains. Overall, the goal is to deepen our understanding of metastatic colorectal cancer and improve treatment strategies through advanced computational biology techniques.

  • A man in a yellow protective suit taking a selfie in a controlled environment area with signs that read 'NOTICE CONTROLLED ENVIRONMENT KEEP DOOR CLOSED' and instructions to wear gloves, coveralls, boots, and facemask.

    Fabrication of spatially resolved microchips

    This summer project focuses on enhancing microST, an open-source platform for spatial transcriptomics that uses cost-effective microfluidic devices to create modular DNA microarrays for high-throughput tissue analysis. It aims to re-engineer the fabrication workflow and develop new multiomics designs by integrating advanced 3D fabrication, microchip production, and rigorous quality control techniques. Ultimately, the project seeks to improve the accessibility and flexibility of spatial transcriptomics tools to address new biological challenges.

  • A scientist or researcher in a laboratory working with a pipette at a cluttered lab bench filled with equipment, supplies, and chemicals.

    Engineering RNA sensors for prime editing

    This project leverages brain-wide and age-related transcriptomic atlases to overcome traditional genetic tool limitations by enabling cell type- and state-specific manipulations through transcriptomic engineering. It utilizes RNA vector programming and both pooled and single-cell screens to identify sensors for aging-relevant cell types and states. Over the summer, the project will focus on developing essential molecular biology techniques and optimizing quality control workflows for a prime editing system.

Techniques

Research papers

Vickovic Lab

  • INLAomics for Scalable and Interpretable Spatial Multiomic Data Integration

    INLAomics for Scalable and Interpretable Spatial Multiomic Data Integration

    bioRxiv [Preprint]. 2025 May 8

  • Tissue and cellular spatiotemporal dynamics in colon aging

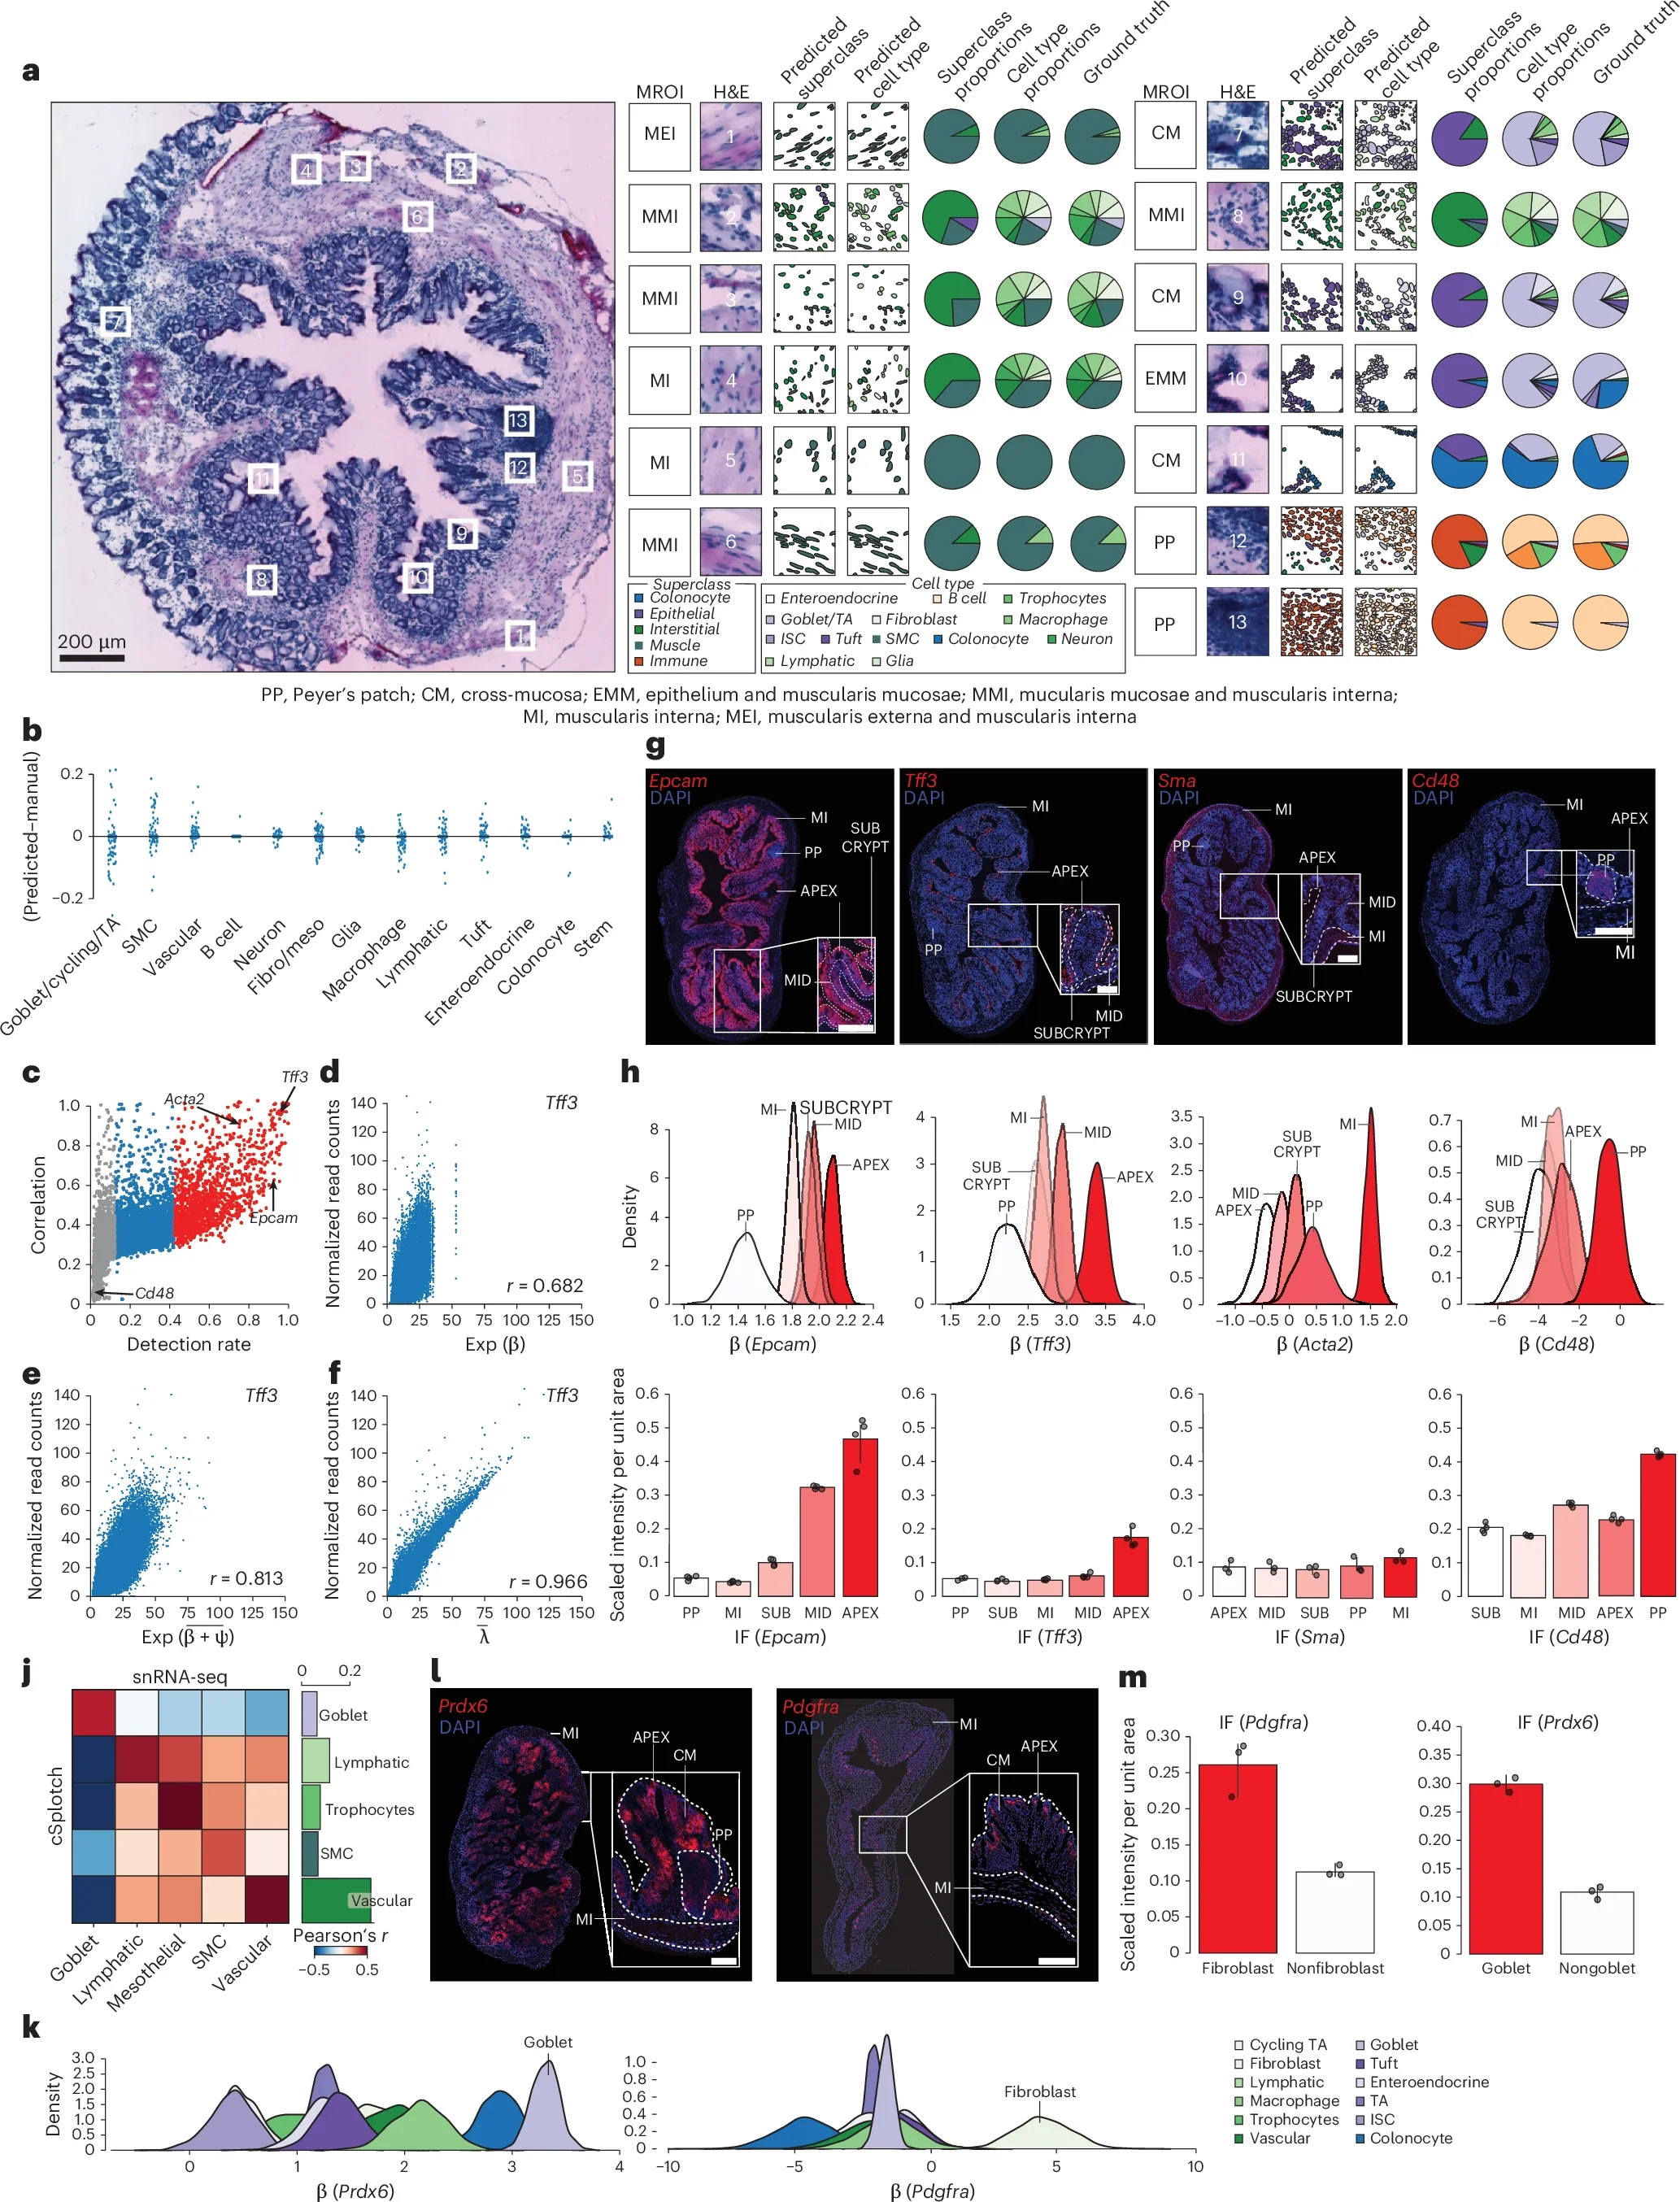
    Tissue and cellular spatiotemporal dynamics in colon aging

    Nature Biotechnology. 2025 October 22.

  • Diagram explaining a method for analyzing the recovery of red blood cells in tissue samples using imaging and computational techniques. Includes illustrations of sample testing, spatial data analysis, power detection curve, tissue scaffolding, biological knowledge incorporation, and cell-type labeling.

    In silico tissue generation and power analysis for spatial omics

    Nature Methods. 2023 March 2.

  • Flowchart of a scientific study on mice tissue analysis, showing sample sources, processing steps including histology, array design, DNA and RNA analysis, and data analysis with gene expression and annotation charts.

    Spatial host-microbiome sequencing.

    Nature Biotechnology. 2023 Nov 20.

  • A set of scientific plots showing brain analysis with various color-coded maps indicating cell area, macrophage score, fibroblast score, and clustering of different cell types across brain sections.

    Three-dimensional spatial transcriptomics uncovers cell type localizations in the human rheumatoid arthritis synovium.

    Nature Communications Biology. 2022 February 11.

  • Diagram showing tissue staining and imaging, high-throughput SM-Omics platform, in situ tissue reactions for cDNA capture, and RNA-Seq library preparation. Sections include a mouse brain, tissue processing steps, a liquid handler robot, Bravo deck, and various imaging and molecular techniques.

    SM-Omics is an automated platform for high-throughput spatial multi-omics.

    Nature Communications. 2022 February 10.

  • A scientific diagram outlining the methodology, sample preparation, and sequencing analysis steps for tissue analysis. The methodology section includes steps like silicon wafer preparation, array wells, single well bead loading, bead surface preparation, and oligo processes. Sample preparation shows tissue resection, image recording, and sequencing. Sequencing analysis covers library prep, barcoding, demultiplexing, and gene expression profiling. Additional panels display microscopic images, annotations, spatial transcriptomics data, and gene expression heatmaps through various plots.

    High-definition spatial transcriptomics for in situ tissue profiling.

    Nature Methods. 2019 Sept. 9.

  • Figure showing gene expression in the mouse spinal cord. Panel A displays a schematic cross-section of the spinal cord with ventral and dorsal horns, along with spatial gene expression maps and immunofluorescence images. Panel B compares mRNA expression levels of Aif1 and Gfap at P70 and P100 between SOD1-WT and SOD1-G93A groups. Panel C shows Z-projections of immunofluorescence images with AIF1 and GFAP markers at P70 and P100.

    Spatiotemporal dynamics of molecular pathology in amyotrophic lateral sclerosis.

    Science. 2019 Apr. 5.

  • Composite image with six panels showing bioinformatics data. Panels a and b display line graphs of unique gene counts versus raw reads from different arrays. Panel c is a bar chart showing the number of unique transcripts and genes identified through various sequencing methods, with labels indicating sample sizes. Panel d is a scatter plot of Dim1 versus Dim2 from a dimensionality reduction analysis, with points colored by category. Panel e is a Venn diagram illustrating the overlap between singles and RNA-seq data, with total numbers for each category. Panel f is a scatter plot showing the correlation between log2 normalized counts of single and RNA-seq data, with correlation coefficients and a DOR value indicated.

    Massive and parallel expression profiling using microarrayed single-cell sequencing.

    Nature Communications. 2016 Oct. 14.

  • Scientific diagram showing tissue processing steps for cDNA synthesis and gene expression imaging, a microscopic image of tissue sections stained with Hematoxylin and Eosin, a fluorescence image of the tissue, and close-up images of cellular structures with labeled regions.

    Visualization and analysis of gene expression in tissue sections by spatial transcriptomics.

    Science. 2016 Jul. 1.

Technology Innovation Lab

  • A scientific figure with multiple panels (A-K) showing data visualizations and plots related to cell gene expression analysis. Panel A displays UMAP plots of PBMCs with cell type annotations. Panel B presents UMAP plots for various cell types, color-coded by gene expression levels. Panel C features a heatmap comparing histone modifications. Panel D shows a scatter plot related to histone modifications. Panel E illustrates a gene expression profile. Panel F compares cell type fractions across different conditions. Panel G depicts additional UMAP plots. Panel H shows a violin plot of total fragments. Panel I presents a trajectory analysis of B cells. Panel J and K show heatmaps of gene expression patterns.

    Nanobody-tethered transposition allows for multifactorial chromatin profiling at single-cell resolution.

    Nature Biotechnology. 2022 Dec 19.

  • Diagram showing schematic of a flow cytometry setup, including reagent tubes, valves, a flow cell, and a syringe pump, with labeled components and a graph of temperature and flow rate over time.

    PySeq2500: An open source toolkit for repurposing HiSeq 2500 sequencing systems as versatile fluidics and imaging platforms.

    Scientific Reports. 2022 Mar. 24.

  • Diagram showing the process of direct RNA nanopore sequencing, including RNA modification, shape adduct, current measurement over time, and how sequencing data is analyzed with rRNA modifications, RNA structure, nanopore reads, and sequence alignment.

    Direct detection of RNA modifications and structure using single molecule nanopore sequencing.

    Cell Genomics. 2022 Feb 9.

  • Scientific diagram illustrating chromatin accessibility, surface proteins, mitochondrial DNA mutations, and sequencing data comparisons across mouse, human, and mixed samples, with graphs and cell type annotations.

    Scalable, multimodal profiling of chromatin accessibility, gene expression and protein levels in single cells.

    Nature Biotechnology. 2021 June 3.

  • Diagram showing the process of single-cell multimodal data technologies, combining RNA and protein data with Weighted Nearest Neighbors, leading to scRNA query mapping in a multicolored scientific illustration.

    Integrated analysis of multimodal single-cell data.

    Cell. 2021 May 31.

  • Diagram illustrating a method for analyzing cell transgene expression. It includes steps of transducing cells with CRISPR library, adding barcode, pooling and splitting cells, followed by PCR and sequencing. Graphs display data on human vs mouse gRNA reads, collision rates, and fragment size distribution.

    Profiling the genetic determinants of chromatin accessibility with scalable single-cell CRISPR screens.

    Nature Biotechnology. 2021 Apr. 29.

  • A scientific figure illustrating gene regulation and immune cell analysis. It includes diagrams of gene expression changes with stim and unstim conditions, flow cytometry histograms for PD-L1 and CD86 proteins, CITE-seq density plots for immune markers, and box plots showing data distributions related to immune checkpoints.

    Characterizing the molecular regulation of inhibitory immune checkpoints with multimodal single-cell screens.

    Nature Genetics. 2021 Mar. 1

  • Diagram showing steps for preparing a barcoded pMHC multimer library, labeling and purifying antigen-specific T cells, and identifying T cell receptor specificities through barcode and DNA amplification techniques.

    High throughput pMHC-I tetramer library production using chaperone-mediated peptide exchange.

    Nature Communications. 2020 Apr. 20.

  • Diagram illustrating multi-modal single-cell data analysis, including gene expression, spatial transcriptomics, chromatin accessibility, and immunophenotyping. Shows process of data transfer, integration, reference assembly, classification, and prediction.

    Comprehensive Integration of Single-Cell Data.

    Cell. 2019 June 6.

  • Figure illustrating gene expression analysis techniques, including transcript capture, protein tagging, and guide tag methods; graphs showing mouse and human transcript and sgRNA counts; a mixed species sample experiment with cell scatter plots; and immunofluorescence images comparing different gene markers.

    Multiplexed detection of proteins, transcriptomes, clonotypes and CRISPR perturbations in single cells.

    Nature Methods. 2019 Apr 22.

  • Scientific diagrams showing data analysis related to gene expression (BRCA, HNSC, KIRC, LUAD, STAD). Includes scatter plots, pie charts, and detailed genetic sequence information, with labels, legends, and annotations.

    Somatic mutations and cell identity linked by Genotyping of Transcriptomes.

    Nature. 2019 July 3.

  • Diagram of a fluid separation process showing droplets being input into devices with magnets and electrodes, resulting in droplet collection and waste output, highlighting different outputs with colored diagrams.

    High-throughput magnetic particle washing in nanoliter droplets using serial injection and splitting.

    Micro and Nano Systems Letters. 2018 June 21.

  • Diagram of a scientific experiment involving afatinib-sensitive PC9 cells, including procedures like co-transfection, selection with puromycin, and expansion of afatinib-resistant clones. Western blot analysis shows protein expressions related to EGFR, p-MET, MET, p-SFK, YES, p-YAP1, YAP1, and GAPDH. Additional panels display dot plots related to clone identification and AKT pathway analysis.

    YES1 amplification is a mechanism of acquired resistance to EGFR inhibitors identified by transposon mutagenesis and clinical genomics.

    Proc Natl Acad Sci U S A. 2018 June 6.

  • Diagram illustrating the process of single-cell RNA sequencing, including tissue dissociation, cell capture, droplet encapsulation, and gene sequencing; microscopic image of tissue sample with labeled cell types; visual clustering of different immune cell populations with color labels; stacked bar charts showing cell population fractions across samples; scatter plots showing gene expression levels in macrophages and CD8+ T cells.

    Single-cell RNA-seq of rheumatoid arthritis synovial tissue using low-cost microfluidic instrumentation.

    Nature Communications. 2018 Feb. 23.

  • Diagram of a single-cell RNA sequencing protocol illustrating sample preparation, cell barcoding, library prep, sequencing, and data analysis, including clustering and visualization of data in different plots.

    Cell Hashing with barcoded antibodies enables multiplexing and doublet detection for single cell genomics.

    Genome Biology. 2018 Dec. 19.

  • Diagram of ELISA test process, showing antibody binding to antigen, droplet encapsulation, cell lysis, and bead hybridization with mRNA and antibody-oligo.

    Large-scale simultaneous measurement of epitopes and transcriptomes in single cells.

    Nature Methods. 2017 July 31.